

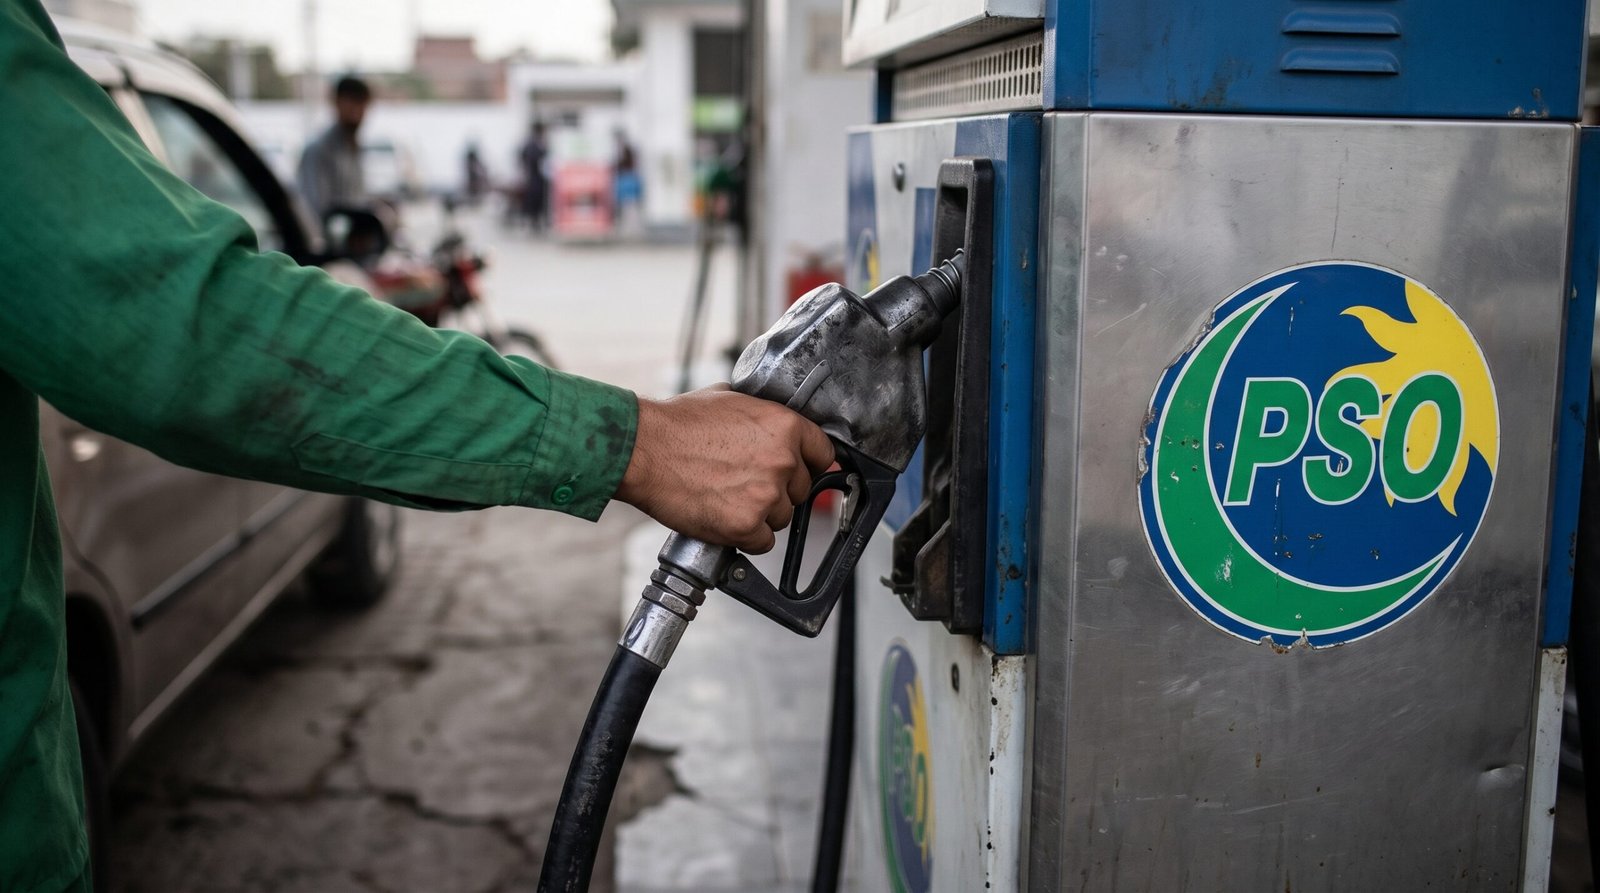
Pakistan State Oil (PSO) emerged as the largest revenue generator among the companies featured in Pakistan’s FY2026 rankings, recording annual net sales of Rs3.05 trillion for the financial year ended June 30, 2026, according to financial results published on the Pakistan Stock Exchange (PSX).
The oil marketing giant maintained a substantial lead over other major listed businesses, with Attock Petroleum securing second place at Rs533.10 billion, followed by Oil and Gas Development Company Limited (OGDC) at Rs449.19 billion.
The rankings, based on standalone financial results of non-financial companies with a June fiscal year-end, highlight the considerable scale of business activity in Pakistan’s energy sector, which accounts for eight of the ten companies featured.
However, the financial results also reveal that companies generating the highest revenues do not necessarily deliver the strongest profits, with operating expenses, production costs and financial charges significantly affecting their bottom lines.
Pakistan State Oil Maintains Dominance Despite Declining Sales
Pakistan State Oil retained a commanding position in the revenue rankings, generating Rs3,050.03 billion in net sales during FY26, compared with Rs3,149.39 billion in FY25.
The figures represent a year-on-year decline of approximately 3.2%, although the company continued to operate at a substantially larger revenue scale than the other businesses included in the ranking.
Despite generating more than Rs3 trillion in annual sales, PSO reported a profit after taxation of Rs15.07 billion, down from Rs20.91 billion in the previous financial year.
This translates into a net profit margin of approximately 0.49%, illustrating the relatively narrow proportion of revenue ultimately retained as profit.
The company’s gross profit nevertheless increased from Rs96.71 billion to Rs99.94 billion, reflecting an improvement in its gross profitability despite lower net sales.
According to PSO’s FY26 financial analysis, operating profit declined amid higher administrative and marketing expenses and reduced other income.
However, finance costs fell from Rs33.72 billion in FY25 to Rs25.65 billion in FY26, providing some relief to the company’s financial performance.
The figures demonstrate that PSO’s dominant position in revenue generation does not automatically translate into similarly dominant profitability.
Attock Petroleum Records Rs533 Billion in Annual Revenue
Attock Petroleum Limited secured second position in the ranking, reporting annual sales of Rs533.10 billion in FY26, compared with Rs474.10 billion during the previous year.
The increase represents year-on-year revenue growth of approximately 12.4%.
The company’s profitability improved considerably, with profit after taxation rising from Rs10.39 billion in FY25 to Rs16.96 billion in FY26, an increase of approximately 63.2%.
Its net profit margin improved from 2.19% to 3.18%, while earnings per share climbed from Rs83.53 to Rs136.31.
Although Attock Petroleum generated substantially lower annual sales than PSO, its reported net profit exceeded that of the larger oil marketing company.
The comparison highlights the importance of examining operating performance and profitability alongside headline sales figures when assessing listed businesses.
OGDC Generates Rs242 Billion Profit on Rs449 Billion Sales
Oil and Gas Development Company Limited ranked third in the revenue comparison, recording annual net sales of Rs449.19 billion, compared with Rs401.18 billion in FY25.
This represents revenue growth of approximately 12%.
However, OGDC’s profitability provides one of the most significant contrasts within the rankings.
The company reported profit after taxation of Rs242.37 billion during FY26, compared with Rs169.90 billion in the previous financial year, representing an increase of approximately 42.7%.
Its net profit margin reached approximately 53.96%, substantially higher than the margins reported by the leading oil marketing companies.
“In absolute terms, OGDC generated significantly less revenue than PSO but earned more than 16 times PSO’s reported net profit.”
In absolute terms, OGDC generated significantly less revenue than PSO but earned more than 16 times PSO’s reported net profit.
The difference reflects the contrasting financial characteristics of their business activities, including how costs and expenses affect final earnings.
The results underline why revenue rankings alone cannot establish which company is financially stronger or represents a more attractive investment.
National Refinery and Cnergyico Among Top Revenue Generators
National Refinery Limited secured fourth position, generating annual sales of Rs440.84 billion in FY26, compared with Rs307.66 billion in the previous year.
The increase represents approximately 43.3% year-on-year revenue growth.
The refinery also returned to profitability, reporting a net profit of Rs6.16 billion, compared with a loss of Rs14.87 billion in FY25.
Despite the turnaround, National Refinery’s net profit margin remained relatively modest at approximately 1.40%.
Cnergyico PK Limited followed in fifth position, recording annual revenue of Rs410.21 billion, compared with Rs296.72 billion in FY25.
The company achieved revenue growth of approximately 38.2%, while reporting a net profit of Rs10.75 billion, reversing the previous year’s loss of Rs2.90 billion.
Cnergyico’s net profit margin stood at approximately 2.62% during FY26.
The results show that both companies experienced substantial revenue growth and improved profitability during the financial year, although their net margins remained considerably below those of major upstream oil and gas producers.
Pakistan Refinery and Attock Refinery Report Higher Earnings
Pakistan Refinery Limited occupied sixth position in the ranking, with annual sales reaching Rs350.84 billion, compared with Rs310.35 billion in FY25.
The company recorded revenue growth of approximately 13% and reported a profit after taxation of Rs15.78 billion, compared with a net loss of Rs4.66 billion in the preceding year.
Its net profit margin improved to approximately 4.50%, marking a substantial recovery in reported financial performance.
Attock Refinery Limited followed closely in seventh position, generating Rs341.59 billion in annual sales, up from Rs301.33 billion in FY25.
The increase represents revenue growth of approximately 13.4%.
The company reported profit after taxation of Rs22.10 billion, compared with Rs11.97 billion in the previous financial year.
Its net profit margin reached approximately 6.47%, exceeding those reported by several other refining and oil marketing businesses in the ranking.
The profitability improvements recorded by both refineries demonstrate that financial performance varied considerably across the downstream energy sector during FY26.
Also Read: Pakistan’s Development Divide Exposed As Welfare Index Reveals Stark District Inequalities
Pakistan Petroleum Reports Rs264 Billion in Revenue
Pakistan Petroleum Limited secured eighth position, recording annual sales of Rs264.01 billion, compared with Rs242.52 billion in FY25.
The company achieved revenue growth of approximately 8.9%.
Profit after taxation increased from Rs92.03 billion to Rs98.53 billion, representing growth of approximately 7.1%.
Pakistan Petroleum’s net profit margin stood at approximately 37.32%, considerably higher than the margins recorded by oil marketing and refining companies.
Together, the results of OGDC and Pakistan Petroleum demonstrate the substantial profitability achieved by these two upstream energy producers relative to their sales.
Their combined net profits reached approximately Rs340.91 billion during FY26, highlighting the distinction between revenue scale and earnings generation within Pakistan’s energy industry.
Indus Motor and Sazgar Represent Automobile Industry
Outside the energy sector, Indus Motor Company and Sazgar Engineering Works were the only automobile-related manufacturers included in the ten-company ranking.
Indus Motor secured ninth position, reporting annual sales of Rs258.75 billion, compared with Rs215.14 billion in FY25.
The increase represents year-on-year revenue growth of approximately 20.3%.
The company also recorded an improvement in profitability, with profit after taxation rising from Rs23.01 billion to Rs25.51 billion.
Its net profit margin stood at approximately 9.86% during FY26.
Sazgar Engineering Works completed the ranking in tenth position, generating annual sales of Rs191.72 billion, compared with Rs108.69 billion in the previous financial year.
The increase represents approximately 76.4% revenue growth, the strongest percentage increase among the ten companies featured in the comparison.
Sazgar’s profit after taxation rose from Rs16.34 billion to Rs23.60 billion, representing growth of approximately 44.5%.
Its net profit margin stood at approximately 12.31%, higher than that of Indus Motor despite the company’s smaller revenue base.
The results highlight the substantial revenue expansion recorded by Sazgar during FY26 and the contrasting profitability levels of Pakistan’s major automobile manufacturers.
Energy Companies Account for Over 90% of Combined Revenue
The dominance of the energy sector becomes particularly clear when the combined sales of the ten companies are examined.
Together, the businesses featured in the ranking generated approximately Rs6.29 trillion in annual revenue during FY26.
Of this amount, the eight energy companies accounted for approximately Rs5.84 trillion, representing nearly 92.8% of the group’s combined revenue.
The two automobile manufacturers contributed approximately Rs450.47 billion, or 7.2% of the total.
Pakistan State Oil alone accounted for approximately 48.5% of the combined sales reported by the ten companies.
These figures demonstrate the concentration of sales revenue among energy-related businesses within this particular group of large listed companies.
However, the ranking should not be interpreted as a measure of the energy sector’s contribution to Pakistan’s “gross domestic product” or the total revenue of every company listed on the PSX.
It covers a selected group of non-financial companies reporting results for the financial year ended June 30, 2026, and does not represent all listed businesses or the entire national corporate sector.
Why Higher Revenue Does Not Necessarily Mean Higher Profit
The FY26 results reveal substantial differences between the companies’ revenue rankings and their profitability.
PSO generated the highest annual sales at Rs3.05 trillion, but its reported net profit stood at Rs15.07 billion.
In comparison, OGDC generated Rs449.19 billion in sales and earned Rs242.37 billion in net profit, while Pakistan Petroleum reported Rs98.53 billion in profit against Rs264.01 billion in sales.
Similarly, Attock Refinery earned Rs22.10 billion on revenue of Rs341.59 billion, while Sazgar generated Rs23.60 billion in profit from substantially lower sales of Rs191.72 billion.
These differences reflect the importance of profit margins, production and operating costs, financing expenses, taxation and the nature of each company’s business activities.
Revenue measures the amount a business generates through sales, while net profit represents the earnings remaining after relevant expenses and taxes have been accounted for.
A company operating with large sales volumes and narrow margins may therefore report lower earnings than a smaller business with stronger margins.
“For investors, revenue growth is only one component of financial analysis. Profitability, cash flows, debt obligations, dividend sustainability, valuation and exposure to industry-specific risks are also important considerations.”
For investors, revenue growth is only one component of financial analysis. Profitability, cash flows, debt obligations, dividend sustainability, valuation and exposure to industry-specific risks are also important considerations.
The FY26 figures provide a comparison of financial scale and profitability but do not, on their own, establish which company offers the strongest long-term investment potential.
What FY26 Revenue Rankings Reveal About Pakistan’s Corporate Sector
The financial results of Pakistan’s leading listed businesses reveal two important characteristics of the companies included in the FY26 comparison.
First, energy-related businesses account for the overwhelming majority of combined sales, with PSO maintaining a substantial lead over the other companies.
Second, profitability varies significantly, even among businesses operating within the same broad industry.
While PSO remains the largest revenue generator in the ranking, OGDC and Pakistan Petroleum report substantially higher net profit margins. Meanwhile, several refining companies recorded improved financial performance after losses in the previous year.
The automobile sector also recorded notable revenue growth, particularly at Sazgar Engineering Works, which reported the strongest percentage increase in annual sales among the ten businesses.
The results demonstrate that corporate size, measured through revenue, is not necessarily an indication of financial efficiency, profitability or investment value.
For a more complete assessment of Pakistan’s listed corporate sector, revenue figures must be considered alongside earnings performance, financial stability and the distinct operating conditions facing each industry.