

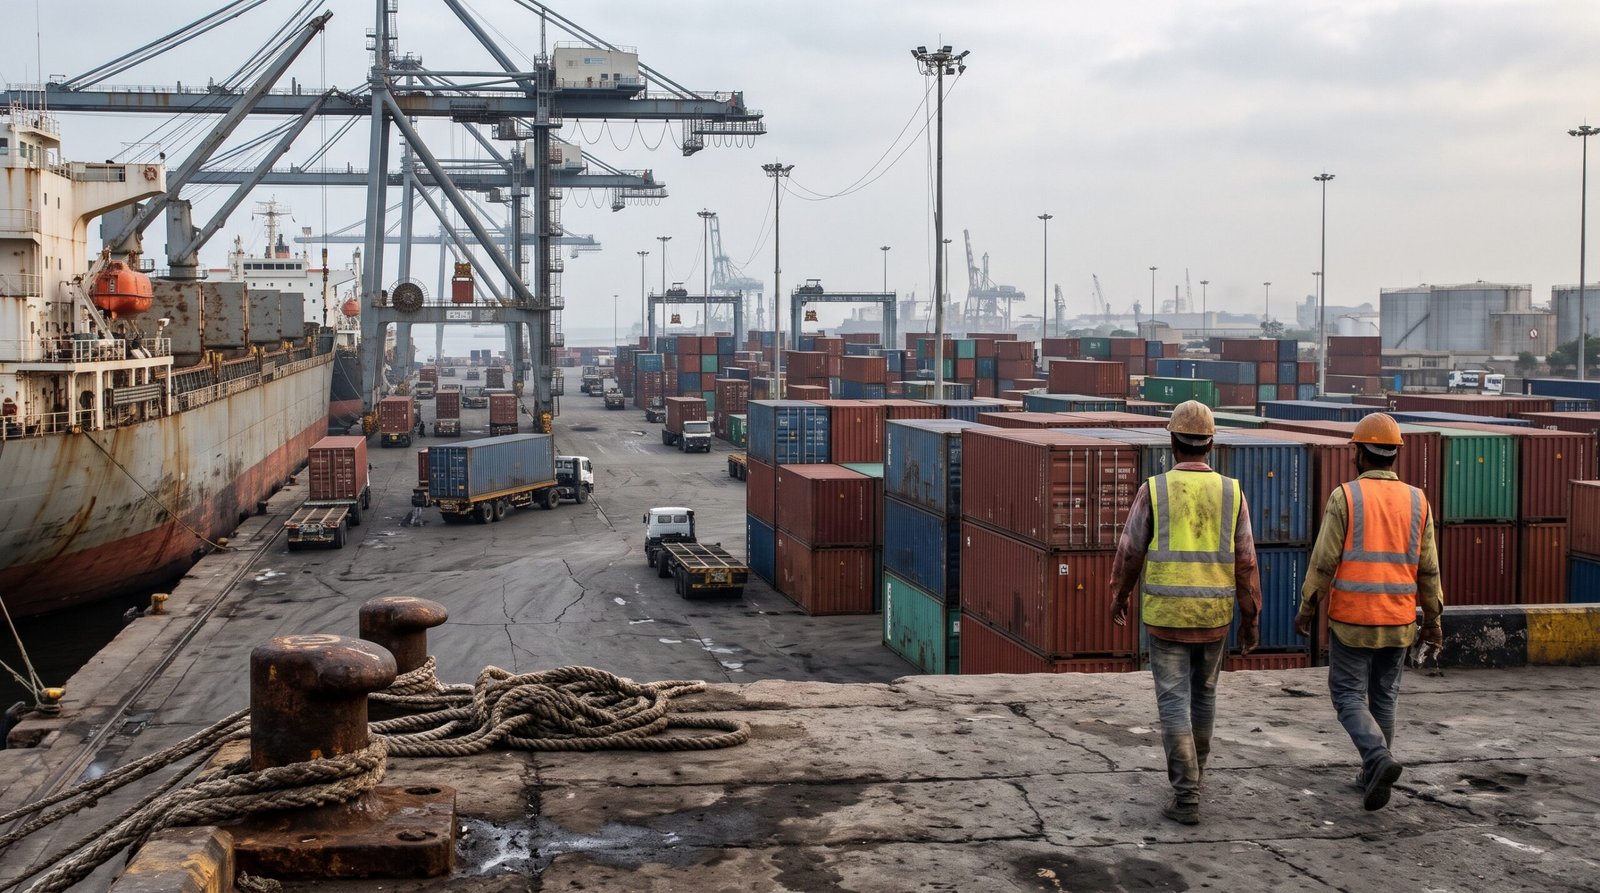
Pakistan’s external trade imbalance deteriorated sharply in October 2026, with the merchandise trade deficit expanding 19.87% month-on-month to $4.13 billion from $3.45 billion in September, as a broad-based surge in energy, industrial metal, and fertilizer imports overwhelmed stagnant export receipts.
According to provisional data published in the Pakistan Bureau of Statistics (PBS) “Advance Release on External Trade Statistics”, the October shortfall stood 27.57% wider than the $3.24 billion deficit recorded in October 2025. Monthly exports edged up a marginal 0.13% month-on-month to $3.00 billion from $2.99 billion in September—representing a 5.16% year-on-year gain over $2.85 billion—while imports jumped 10.70% on the month and 17.09% on the year to $7.13 billion, compared with $6.44 billion in September and $6.09 billion a year earlier.
In local currency terms, October exports remained virtually flat at Rs829.47 billion against Rs829.46 billion in September (up 3.61% year-on-year from Rs800.55 billion). Imports climbed 11.17% month-on-month and 15.98% year-on-year to Rs1,987.54 billion, resulting in a monthly rupee trade deficit of Rs1,158.07 billion—up 20.84% from September and 26.83% from October 2025.
| Indicator | Oct-26 | Sep-26 | Oct-25 | MoM | YoY |
| Exports ($bn) | 3.00 | 2.99 | 2.85 | 0.13% | 5.16% |
| Imports ($bn) | 7.13 | 6.44 | 6.09 | 10.70% | 17.09% |
| Trade Deficit ($bn) | -4.13 | -3.45 | -3.24 | 19.87% | 27.57% |
| Exports (Rs bn) | 829.47 | 829.46 | 800.55 | 0.00% | 3.61% |
| Imports (Rs bn) | 1,987.54 | 1,787.83 | 1,713.65 | 11.17% | 15.98% |
| Trade Deficit (Rs bn) | -1,158.07 | -958.37 | -913.10 | 20.84% | 26.83% |
Source: Pakistan Bureau of Statistics, Advance Release on External Trade Statistics, October 2026
“Imports grew faster than exports in percentage terms and are also the larger base, so the dollar increase on the import side was bigger and the deficit widened further.”
The widening trend is equally pronounced across the first four months of the fiscal year. During July–October FY2026-27, cumulative exports increased 10.16% year-on-year to $11.51 billion from $10.45 billion, while imports expanded 13.99% to $26.29 billion from $23.06 billion. Consequently, the four-month trade deficit grew 17.16% year-on-year to $14.78 billion, compared with $12.61 billion in the corresponding period of FY2025-26.
| Cumulative (Jul–Oct) | FY2026-27 | FY2025-26 | YoY Change |
| Exports ($bn) | 11.51 | 10.45 | 10.16% |
| Imports ($bn) | 26.29 | 23.06 | 13.99% |
| Trade Deficit ($bn) | -14.78 | -12.61 | 17.16% |
| Exports (Rs bn) | 3,193.16 | 2,950.12 | 8.24% |
| Imports (Rs bn) | 7,314.94 | 6,516.68 | 12.25% |
| Trade Deficit (Rs bn) | -4,121.78 | -3,566.56 | 15.57% |
Source: Pakistan Bureau of Statistics
Energy shipments drove the largest share of October’s import expansion. Petroleum crude imports surged 66.88% month-on-month and 57.00% year-on-year to Rs240.14 billion, while refined petroleum product imports dipped 0.16% on the month but rose 6.57% on the year to Rs162.90 billion. Combined, the two energy lines accounted for roughly 20% of the country’s total monthly import bill.
“Together, the two categories made up roughly 20% of the month’s import bill.”
Non-energy industrial and consumer imports compounded the external pressure. Iron and steel imports jumped 71.87% month-on-month and 98.74% year-on-year to Rs138.96 billion, while iron and steel scrap declined 4.65% on the month but rose 20.82% on the year to Rs65.85 billion. Manufactured fertilizer imports spiked 168.92% month-on-month and 43.75% year-on-year to Rs54.94 billion.
Also Read: Fauji Foods Appoints Haseebullah Zahur As Chief Executive Officer
Additional upward pressure stemmed from plastic materials, which rose 5.35% on the month and 43.42% on the year to Rs91.98 billion; palm oil, up 5.45% month-on-month and 11.30% year-on-year to Rs101.56 billion; and mobile phone imports, which climbed 26.42% on the month and 23.39% on the year to Rs50.22 billion. Conversely, electrical machinery and apparatus fell 12.42% month-on-month and 2.72% year-on-year to Rs67.58 billion, while motor cars (CKD/SKD) imports dropped 24.45% on the month to Rs51.41 billion, though remaining 6.75% higher year-on-year.
On the export side, textiles remained the core revenue anchor, though individual sub-sectors posted uneven results. Knitwear—the single largest export earner at Rs135.33 billion—edged up 0.54% month-on-month and 0.05% year-on-year. Readymade garments totaled Rs109.84 billion, slipping 1.34% on the month but gaining 5.37% on the year.
Other major textile lines contracted: bed wear fell 2.25% month-on-month and 4.18% year-on-year to Rs78.40 billion, while cotton cloth declined 5.38% on the month and 3.07% on the year to Rs39.11 billion. Towels eased 0.95% month-on-month to Rs27.59 billion but advanced 8.58% year-on-year. Cotton yarn emerged as the standout textile performer, climbing 26.18% month-on-month and 46.40% year-on-year to Rs23.24 billion, alongside madeup articles (excluding towels and bed wear), which rose 4.91% on the month and 17.55% on the year to Rs22.45 billion.
Outside textiles, fish and fish preparations posted strong growth, rising 22.55% month-on-month and 60.38% year-on-year to Rs18.65 billion. Non-basmati rice exports (others) contracted 29.32% on the month and 4.69% on the year to Rs29.11 billion, while petroleum product exports (excluding top naphtha) surged 68.24% month-on-month to Rs35.92 billion despite remaining 39.79% lower year-on-year.